In this class we study everything with one analyte and, with the exception of IR and NMR labs, we are quantitative in what we do. Our ultimate goal is to determine how much Pb there is in something. To do that we need a very good grasp on calibration curves and what can affect those curves.
Calibration Curves allow us to determine limit of detection (LOD); limit of quantification (LOQ); confidence in the data (confidence limits); sensitivity (slope); and selectivity.
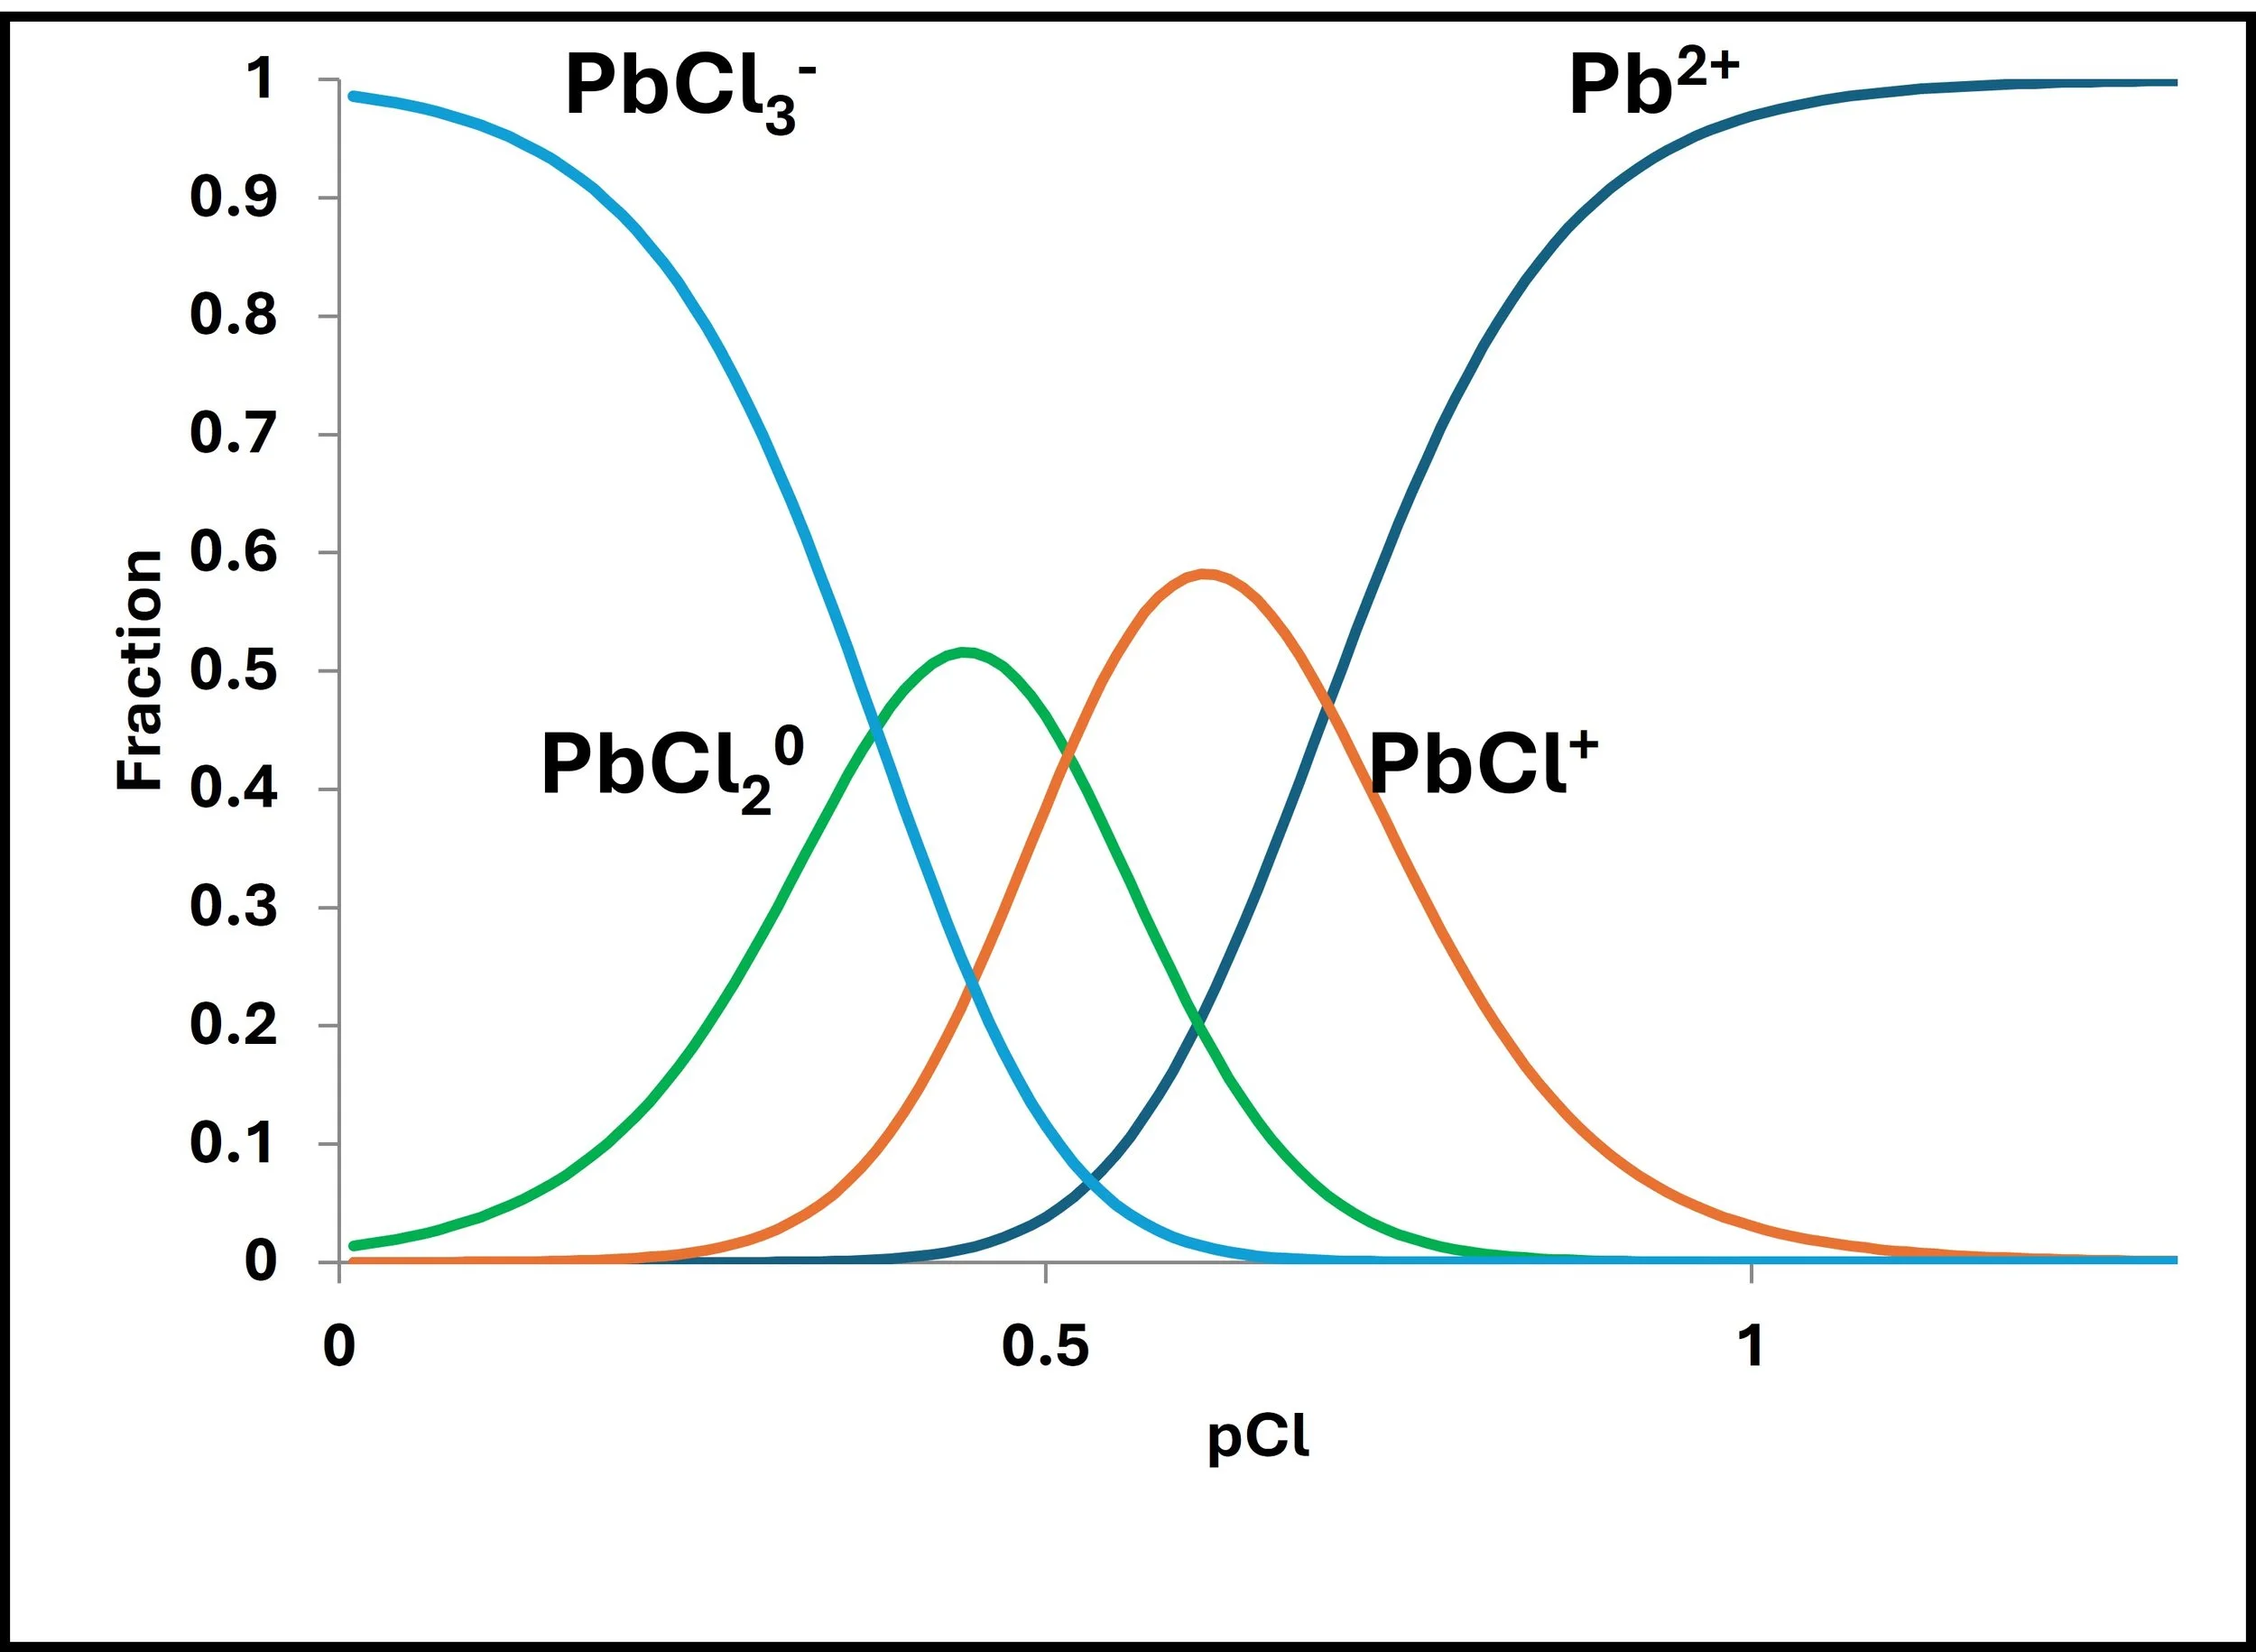
We have to be aware, however, that the matrix of the sample can affect the curve, as shown above. Here the issue is that of the presence of chloride which affects how lead is volatilized in the flame atomic absorption burner (Figure to the right.)
When there are matrix effects like this and they can not be accounted for it is best to obtain the desired information by using standard addition methods.
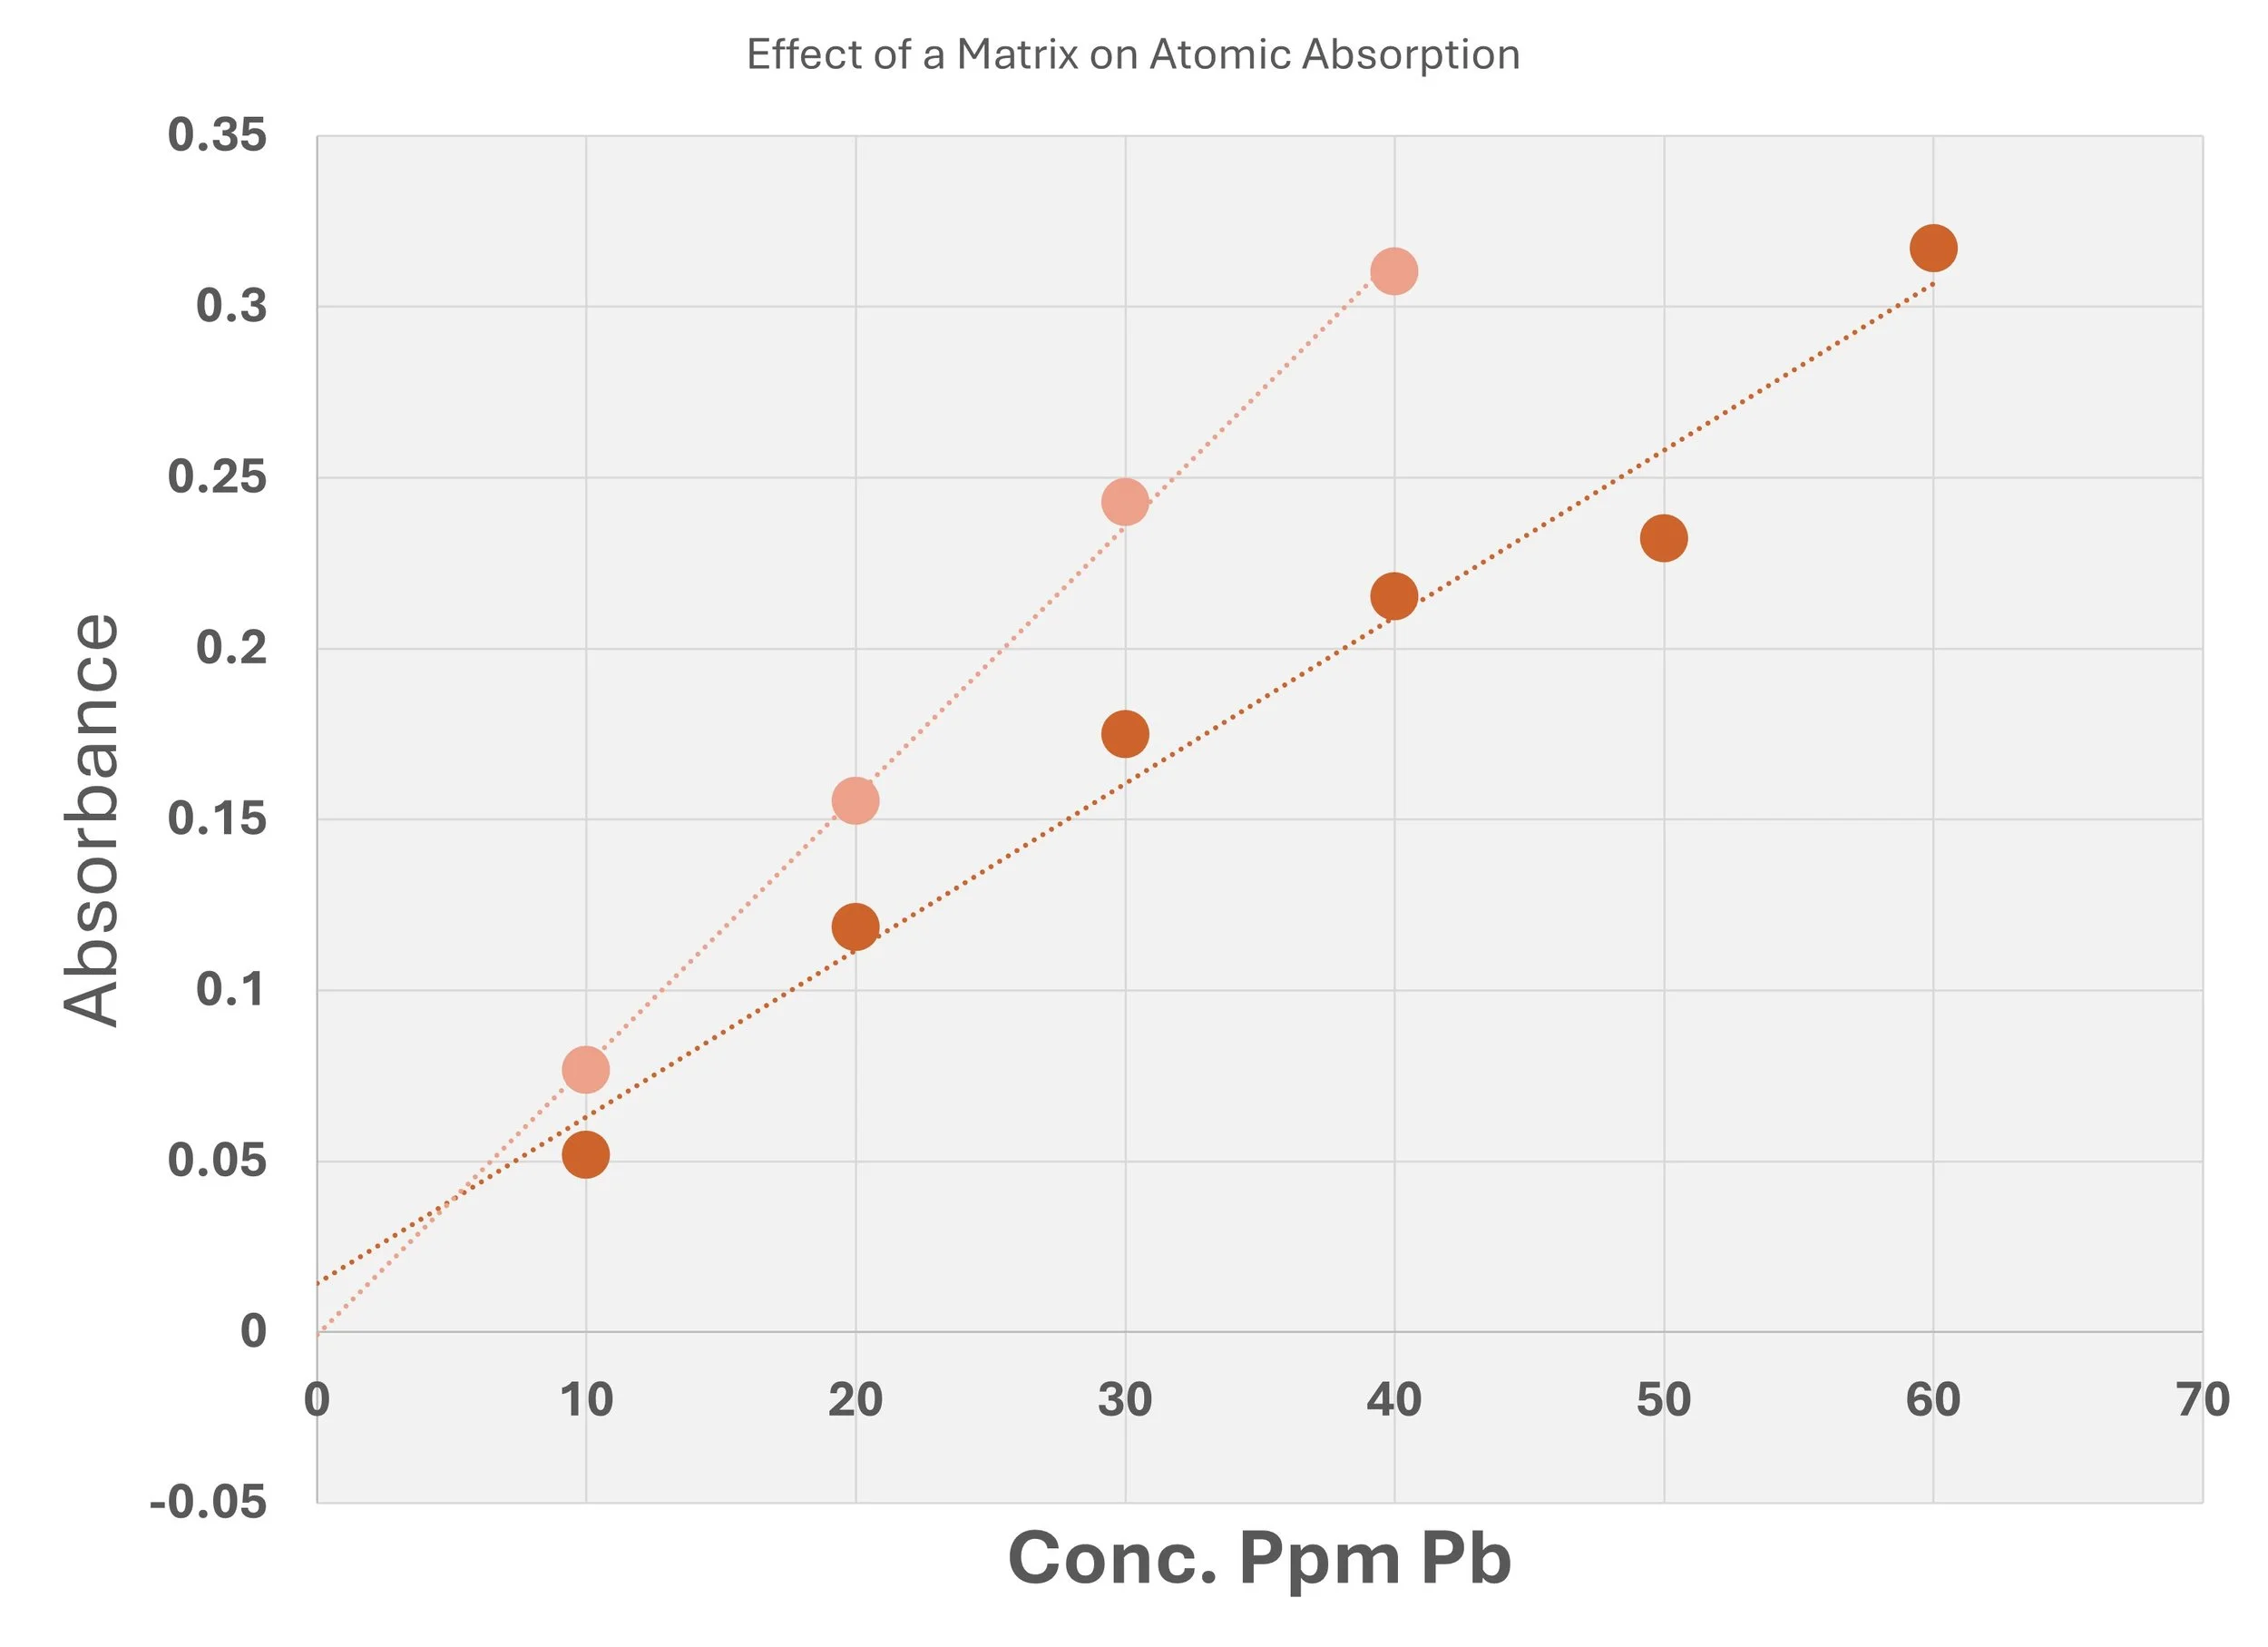
Different slopes are caused by the presence of NaCl where the Cl- complexes Pb. Use Standard Additions in this case.