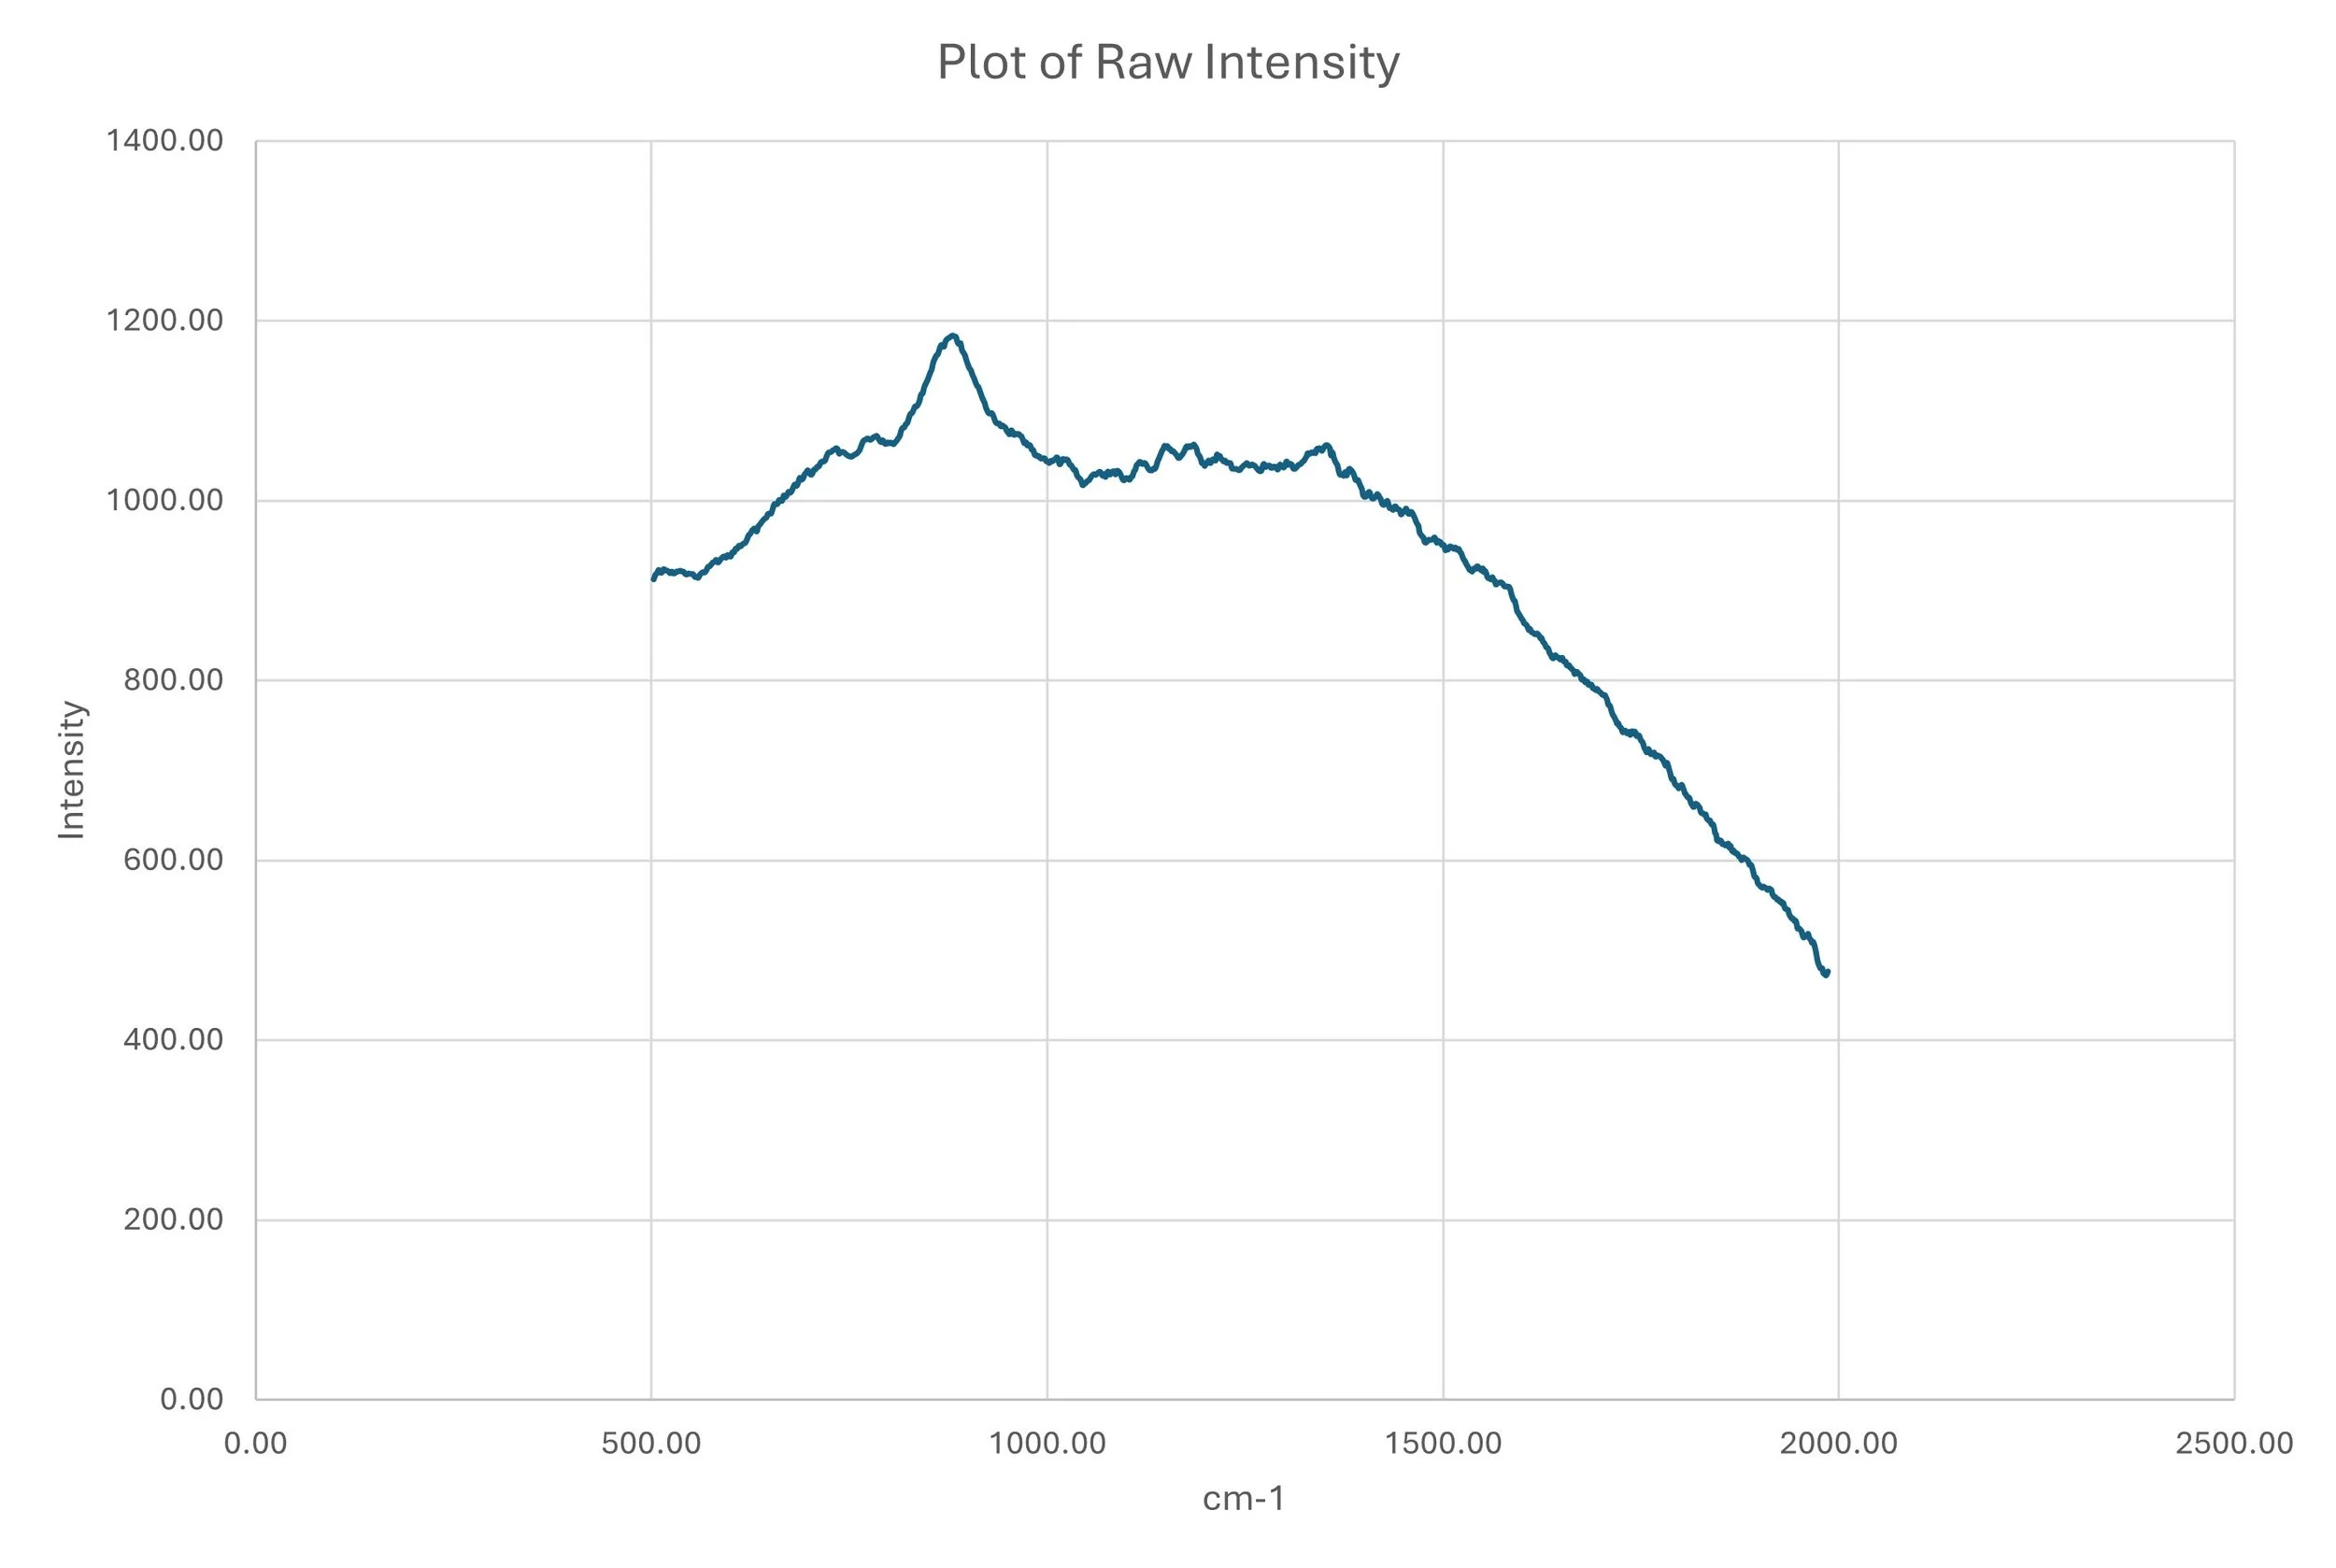
The peak data you want may have a rising slope which affects the peak to base distance. That rising slope can be baseline subtracted. In the Baseline subtraction data a small peak is sitting on top of a large Raman background. Baseline subtraction will allow that peak to be pulled out and quantitated. On many modern instruments embedded software will do this for you but best be prepared for the worst.
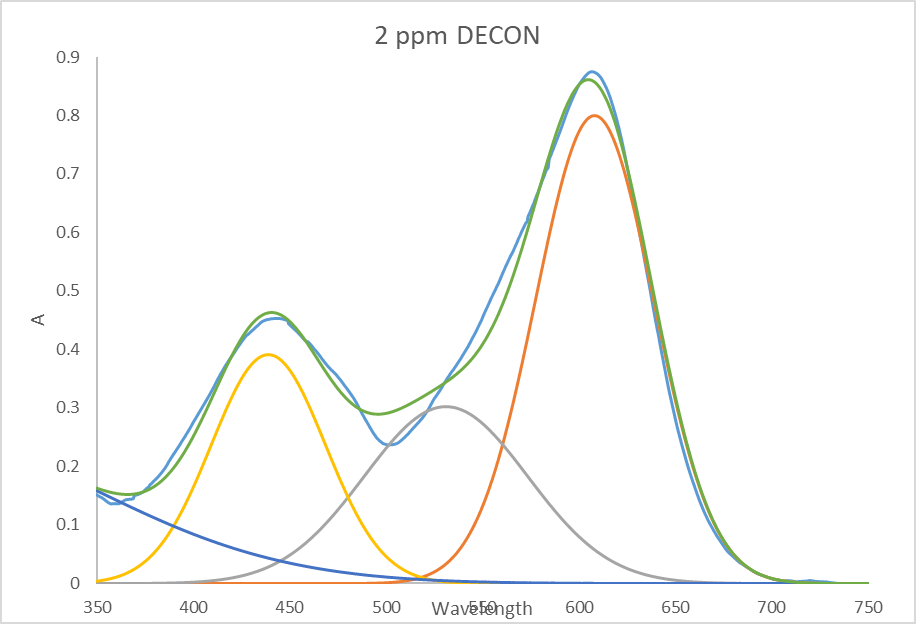
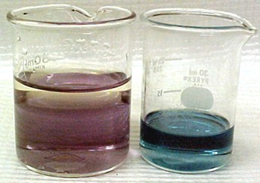
When two peaks are not resolved it is useful to “deconvolve” the peaks. This involves modeling the peaks by Gaussian or Lorentzian parameters and minimizing the difference between the modeled sum of peaks and that observed. Not to worry the minimization portion of the process is, thanks to Excel’s add-in pack for data analysis quite simple. Deconvolution can be used in nearly all of the labs where the peaks are overlapping. Shown here is a student’s attempt to deconvolve and remove the overlapping peaks where pure dithizone absorbs at 410-450 nm and 600-620 nm (green) while metal-complexed dithizone absorbs at 500-520 nm (reddish).